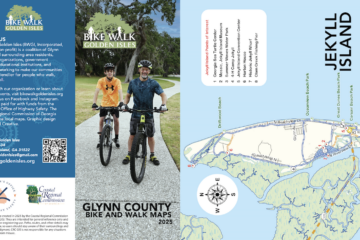
In September of last year, BWGI printed the second edition of our bike and walk maps. BWGI is able to print these maps through a generous grant from the Governor’s Office of Highway Safety, and Read more…
Updated February 26: We are no longer seeking applicants for this role. The position has been filled. Bike Walk Golden Isles is seeking an Executive Director to lead our mission of making Southeast Georgia safer Read more…
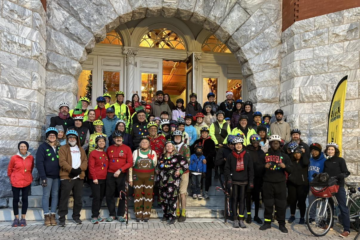
The holiday season in the Golden Isles is always filled with exciting events for everyone and this past December was no different. In December, BWGI led two community rides for bicyclists of all ages and Read more…
0 Comments